HEMODYNAMICS FOR
THE SENIORS
B. Bo Sramek, Ph.D.
International Hemodynamic Society
www.hemodynamicsociety.org
Almost daily, the media, the health care industry and health organizations bombard us with information what we should and should not do in order to live longer and have a better quality of life. Cardiovascular health figures prominently in this barrage of information, since cardiovascular diseases are the major reason for deaths in the older population. Normotension (an arterial blood pressure within a normal range) is heralded to be synonymous with a "healthy" cardiovascular system. On the other hand hypertension, since it is linked down the road to heart failure, myocardial infarctions and strokes, is projected to be a major cardiovascular disease.
This fear of hypertension is warranted - about every third older American is hypertensive.
The health tips usually contain various advices of what to do to keep our blood pressure under control. We are encouraged to measure blood pressure frequently and, if hypertension is detected, to see a doctor and have it treated. Several hundred different antihypertensive medications are available for prescription to our physicians, so their selection choice is not a simple one. In addition to these existing drugs, the pharmaceutical industry introduces every once in a while a new and better "silver bullet" antihypertensive medication: A time ago it used to be the diuretics. Later on the beta and calcium channel blockers became the "drug of choice" for treatment of hypertension. Now the ACE-inhibitors and ARBs are in the vogue. But keep in mind that pharmaceutical companies have a vested interest in hypertension. Just in the US we consume antihypertensive medications worth about $1 Billion every year.
This anti-hypertension blitz is enforced further by a blood pressure measurement performed on us every time we visit a doctor’s office. Noninvasive blood pressure measurement with an occlusive cuff (a sphygmomanometer) has become not only the prominent but also quite often the only noninvasive assessment of our cardiovascular systems.
To make this anti-hypertension crusade complete, the National Institute of Health (NIH) publishes periodically the Report on Treatment of High Blood Pressure, documenting progress being made over time in the US in treatment of this disorder. In the early ‘80s it was 11% of treated hypertensives that had their blood pressure "under control." In the early ‘90s, this number grew to 25%. Though this double increase in outcome is remarkable, the report does not mention the 89% of treated hypertensives in the ‘80s and 75% in the ‘90s, whom, in spite of taking daily doses of antihypertensive medications, had remained hypertensive and exhibit side effects of antihypertensive medications affecting the quality of their lives.
After these tidbits of information, one may almost be convinced that the arterial blood pressure within a normal range is the answer to a healthy cardiovascular system. Is this a fact or just a fiction?
The fact is that we can live without solid food for weeks, without water for days, however, without oxygen just for seconds. The fact is that ECG (electrocardiogram) – the other noninvasive modality used to assess our cardiovascular system - represents the electrical activity of the heart and is unrelated to perfusion of body tissues. The fact is that as we age, in many of us, the blood pressure increases. The fact also is that many individuals can live with hypertension, not even knowing about it. The most important fact, however, is that the primary function of our cardiovascular system is not a generation of blood pressure or ECG but a delivery of oxygen to all tissues.
A delivery of oxygen is a blood flow and not blood pressure-related phenomenon. Oxygen and nutrients are the principal fuel our body needs for normal performance of its organs. Since the body does not have the means to store oxygen, this precious commodity has to be delivered to all tissues continuously. Actually, an adequate delivery of oxygen to all organs under all metabolic conditions (maintaining the oxygen demand and oxygen delivery in equilibrium) is a true definition of cardiovascular health.
The demand for oxygen is the lowest when we rest. From this low level, a human cardiovascular system can increase a demand for oxygen up to five-fold during a peak physical exercise. In a healthy cardiovascular system it is met by up to a five-fold increase in oxygen delivery: When we start running, oxygen demand of skeletal muscles increases and an increased blood flow, carrying oxygen, is directed toward them. After a meal, the gut needs and gets more blood flow and more oxygen for food digestion. When we eat spicy food or drink alcohol it is the liver which demands and gets an increase in oxygen supply. When our body is exposed to temperature extremes, the blood flow to skin increases up to ten-fold in order to maintain its main function – body temperature control.
In contrast to a normal (healthy) responses described above, an unhealthy cardiovascular system does not have the capability to increase oxygen delivery to a documented increase in oxygen demand. Under those conditions, the brain starts a process of reducing blood flow to certain organs to redistribute and utilize among all organs the reduced supply of available oxygen. It assigns priorities to different organs, related to their immediate role in a person’s survival, and individually controls their blood flow, thus a supply of their oxygen. The vital organs (the brain and the heart) usually remain adequately perfused, while the organs lower on the priority list will get their oxygen supply reduced. If a discrepancy between an increased demand and decreased capability of the cardiovascular system to deliver oxygen is severe, the blood flow and oxygen delivery to some organs is almost cut off. Organs with reduced oxygen supply become dysfunctional. If the reduction is severe and prolonged these organs eventually fail.
Being short of breath while climbing several steps, male impotence, digestive disorders, body temperature control problems, tiredness and sleep-walking, even infertility, may be loud demonstrations of reduced capability of our cardiovascular system to deliver an adequate amount of oxygen to all tissues. By the same token, the so-called side effects of antihypertensive or other therapies, which coincide with the list of dysfunctions listed above, may not be the side effects of these therapies at all. They just may be a demonstration of an inadequate supply of oxygen to those organs, which are becoming dysfunctional as a result of an incorrectly chosen therapy.
Actually, hypertension is not a disease. In a majority of cases it is a hemodynamic disorder associated with an increased risk factor for heart failure, myocardial infarction (MI), stroke, or irreversible changes, which take place in the heart and vascular system in a hypertensive patient over time. It is clear that an abnormally high blood pressure must be treated. However, when hypertension is successfully treated (a patient becomes normotensive), it does not make us necessarily live longer. It only does not make our lives shorter due to MI or stroke, triggered by hypertension. On the other hand, an inadequate supply of oxygen to some organs will make these organs perform inadequately or to fail, thus decreasing the quality of life and contributing to an early demise. So it is normal oxygen delivery (and normal delivery of nutrients) produced by normal blood flow, in conjunction with normotension, and not just the normotension, what equates to cardiovascular health, good quality of life and to longevity.
In oxygen transport, blood is the vehicle and oxygen is the cargo. In a normal patient who is not hemorrhaging (i.e., who has the number of oxygen-carrying vehicles constant) and whose lungs are functioning normally (almost all red blood cells – the oxygen-carrying vehicles - leave the lungs carrying oxygen), the only way for his cardiovascular system to respond to a varying oxygen demand is by varying the speed of the vehicles on the road, i.e., by varying the blood flow. This dynamic response of a cardiovascular system to instantaneously increase the oxygen supply when needed is controlled by hemodynamics.
Hemodynamics is a subchapter of cardiovascular physiology, which deals with the forces the pump (the heart) has to develop in order to circulate blood throughout the cardiovascular system. To a physician or nurse, these forces present themselves as blood pressure and blood flow paired values measured simultaneously at different points of the cardiovascular system. Our special interest will be systemic hemodynamics, dealing with blood pressure and blood flow at the output node of the left heart. The reason for being interested in systemic hemodynamics is fairly simple – a significant majority of all cardiovascular disorders and diseases involves the left heart and systemic circulation. Keeping systemic hemodynamics normal by a proper therapy (having both the blood flow and the arterial blood pressure within normal ranges), therefore, makes us cardiovascularly healthy and represents a major step in improving the quality of our life and its duration.
As the heart contracts, it squeezes part of the blood contained within the left ventricle into the aorta and from here the blood flows into the entire cardiovascular system. Since blood is a noncompressible fluid, when it is squeezed into vasculature, which exhibits a resistance to blood flow, a blood pressure is generated. During ventricular contraction (the systolic part of the cardiac cycle) the arterial blood pressure increases to its highest, the systolic level. When the left ventricle is being refilled with a new blood from the lungs during the diastole (the relaxation phase of cardiac cycle) and the ventricle is disconnected from the vasculature due to a closed aortic valve, the pressure in the vasculature decreases during each heart beat to its lowest, diastolic level. The boluses of blood expelled by the left ventricle into the systemic vasculature during every heartbeat represent the blood flow per beat.
As you can see from this explanation, arterial blood pressure and blood flow during every heart beat are interrelated: The blood flow is the cause, while the blood pressure is a consequence – it develops as a result of the blood flow through the resistance of the vasculature. It also is the reason why the hemodynamic parameters (i.e., both the blood flow and the blood pressure) have to be measured together and simultaneously, so as to be able to assess a patient’s This parameter is called the Stroke Volume (SV) and its capability to perform the dynamic modulation of oxygen delivery.
Though studying the dynamic interrelationship between continuously varying blood flow and blood pressure during every heartbeat has a scientific research significance, their mean values per heartbeat are totally adequate for clinical practice.
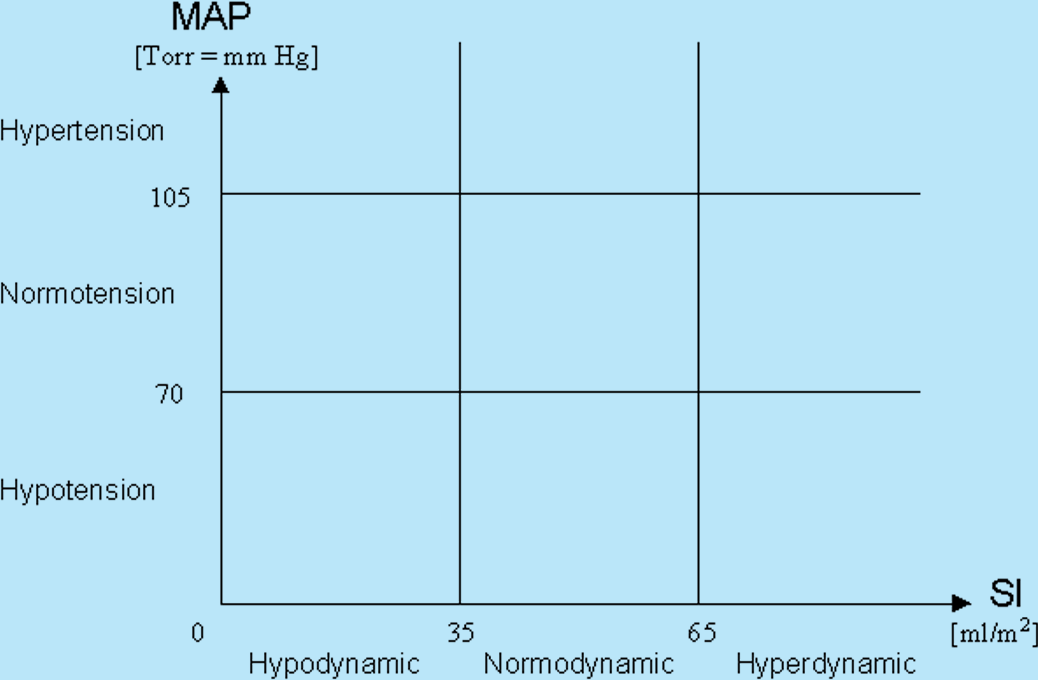
The mean value of blood flow per heartbeat is such a blood flow, which would be delivered into the vasculature if the heart would not be a pulsatile pump but a continuous delivery pump. This parameter is called the Stroke Volume (SV) and is measured in milliliters per beat [ml/beat]. However, the body of each individual contains a different number of cells, which need to be perfused. As a consequence, there would have to be a different value of SV for each individual, which would be considered to be a normal value of blood flow per beat for that individual. Since the amount of body cells is roughly proportional to a height and weight of a person, which is also related to the Body Surface Area (BSA), calculated in meter squared [m2], we use in clinical practice the indexed SV parameter, called the Stroke Index (SI). SI = SV/BSA. SI allows us to use only one normal range for all subjects of all sizes. By measurement of hemodynamics of a large number of hemodynamically normal subjects, it was determined that in middle age and older adults a normal range of SI is between 35 and 65 ml/m2.
The mean value of blood pressure is called the Mean Arterial Pressure (MAP) and is such a value of arterial blood pressure, which would exist in the system if the blood flow leaving the heart would not be pulsatile but a continuous stream of blood. MAP is, typically, one third of the pulse pressure (a difference between the systolic [S] and diastolic [D] pressure values) above the diastolic pressure level. MAP = [(S-D)/3] + D. By measurement of hemodynamics of a large number of hemodynamically normal subjects, it was determined that in middle age and older adults a normal range of MAP is between 70 and 105 mmHg (Torr).
The best way, therefore, to understand and to display the hemodynamic state of a patient is as a point in a two-dimensional map, having the blood pressure (MAP) and blood flow (SI) as its coordinates. Depending on a measured level of blood pressure and blood flow, the hemodynamic point of a patient can land in one of the nine rectangles, defining the nine different classes of hemodynamic states, as shown in Fig.1 below:
As we’ve already explained, a new hemodynamic state, i.e., new values of MAP and SI are formed for every heartbeat. The values of SI and MAP are a result of modulation by three hemodynamic modulators. These modulators are the intravascular volume, inotropy and vasoactivity. Let’s discuss them and explain their modulating function.
The intravascular volume is the simplest hemodynamic modulator in respect to explanation of its function.
At any instant about 20% of our blood is within the arterial system, while the remaining 80% is within the venous system. All fluids we consume have to pass from the digestive tract through the vascular system before being excreted in form of urine or as a component of stool. About 10% of our weight is blood. However, a portion of it is not circulating and is kept in reservoirs, such as the spleen. When needed, this blood is being made available for an increased circulation through venoconstriction of the spleen – this activity can be considered an autotransfusion. When this increased venous return takes place, more blood is coming into the heart chambers and more blood gets ejected during every heartbeat and, as a result, both SI and MAP values increase (a patient hemodynamic point in Fig.1 moves from its starting position anywhere on the map toward northeast). Similar effect can be accomplished by lifting a patient’s legs while in supine position. This way more blood kept in the lower extremities is returned toward the heart due to the effects of gravity. In contrast, when we stand up, the effects of gravity will redistribute our blood toward the lower extremities and both SI and MAP will momentarily decrease (the hemodynamic point will move southwest).
As we inhale, we create a negative pressure within our thorax. This negative intrathoracic pressure is responsible both for inrush of air into our lungs through nose and mouth and for an increase of venous blood return toward the heart. This increased venous return will momentarily move our hemodynamic point northeast. And when we exhale, a positive intrathoracic pressure will expel the air from the lungs, will diminish our venous return and move the hemodynamic point momentarily southwest. This way we have explained the instantaneous, beat-by-beat variation of circulating volume of blood and its effect on both beat-by-beat and long-term variation of SI and MAP values.
All fluids come into our cardiovascular system as drinks or components of food. When we become thirsty, have diarrhea, or have inadequate supply of water, we become hypovolemic. This state will result in decreased values of both SI and MAP for an extended period of time. In contrast to this, when we retain fluids, for instance as a result of consumption of salty food or a diminished function of kidneys, this state is called hypervolemia and will be accompanied with a longer-term increase of both SI and MAP values.
Inotropes are the second hemodynamic modulators.
They are hormone-like substances, which circulate within the blood. When they reach the receptors in the heart, they control and affect the rate of contraction of the heart fibers in time. Positive inotropes increase the rate of contraction of myocardial fibers (they contract more vigorously in a shorter time), the heart expels more blood, and the values of SI and MAP increase. In contrast, the negative inotropes have precisely the opposite effect and, as a result of their presence, the SI and MAP values decrease. Our bodies, by producing either positive or negative inotropes and thus changing instantaneously the level of inotropic state, control the myocardial contractility and, simultaneously, the SI and MAP values. An excessive level of positive inotropes for extended period of time is called hyperinotropy and will result in elevated SI and MAP values and will move the hemodynamic point of a patient northeast for an extended period of time. On the other hand, excess in negative inotropes is called hypoinotropy and will demonstrate itself as a long-term decrease of levels of SI and MAP, moving the hemodynamic point southwest.
Vasoactivity is the third hemodynamic modulating process.
Through vasoactivity the body controls the flow of blood through individual organs. Each organ has at its input level a multitude of sphincters, acting as miniature spigots, which can change a caliber of each arteriole, thus changing their vascular resistances and, therefore, controlling blood flow through each organ. In a healthy cardiovascular system, regional (organ) vasodilatation is used to increase blood flow through an organ when its oxygen demand increases. Regional vasoconstriction is applied to reduce blood flow through an organ.
In contrast to the regional vasoactivity discussed above (i.e., the vasoactivity of individual organs), vasoactivity in hemodynamic sense means a global vasoactivity, i.e., a total sum of vasoactivities of individual organs as seen by the left heart. Global vasoconstriction decreases SI while increasing MAP, moving the hemodynamic point from its starting position northwest. Vasodilatation increases SI while decreasing MAP, thus moving the hemodynamic point southeast.
In the hemodynamic modulation discussion above, we have documented that the heart is a variable volume pump through a variation of blood flow (SI) during each heartbeat (let's forget for a moment that while varying SI the MAP changes as well).
In addition of varying global blood flow through the hemodynamic modulation of blood volume per each heartbeat as described above, there is one modulator over time. This is the variation of Heart Rate (HR), by changing a frequency of ejections of boluses of blood (SI) from the heart in one minute. The heart, therefore, is both a variable volume and variable frequency pump.
This modulation of blood flow over a multitude of heartbeats by variation of HR is called chronotropy. It affects the blood flow per minute, called the Cardiac Index (CI). It should be already clear that CI = SI x HR. In contrast to SI, which is hemodynamically significant blood flow per beat, CI is the perfusion blood flow per minute, with a physical dimension of liters/minute/m2 [l/min/m2] CI is the actual dynamic modulator of oxygen delivery (variation of the speed of blood carrying vehicles on the road). By measuring a large number of normal adults, it has been determined that for resting, supine, healthy middle age and older adults a normal mean value of CI is 3.4 liters/minute/m2 with a +20% range. Since CI = SI x HR, and since the ideal level of SI = 47 ml/m2, there is a corresponding "normal mean" level of HR = 72 beats/min.
The chronotropic modulation is an important line of defense for our bodies, which provides for adequate oxygen delivery even in cases of a patient with a compromised hypodynamic state (infranormal SI), caused by abnormal hemodynamics. Let’s explain this fact on the following example in Table 1:
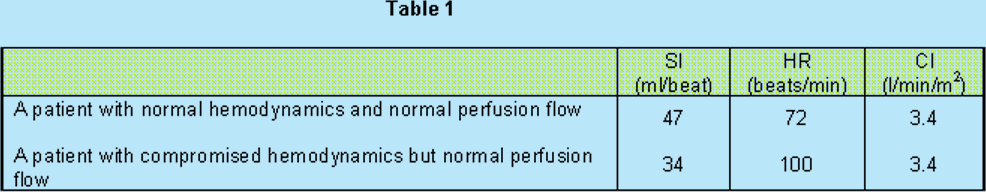
The first line patient’s values are that for an ideal patient. CI = 3.4 l/min/m2 in conjunction with normal level of hemoglobin and normal function of the lungs provides for an ideal level of oxygen delivery. The second line patient’s SI is compromised (a reason maybe hypovolemia, hypoinotropy or vasoconstriction, or their combination). However, since this patient’s brain recognized his decrease of blood flow per beat, it provided instantaneously through the chronotropic compensation for an increase in heart rate to HR = 100 beats/min, resulting also in an ideal value of perfusion blood flow of CI = 3.4 l/min/m2. Though the second line patient’s hemodynamics are not normal (and should be treated), his transport of oxygen will be normal and thus his quality of life at rest will not be impeded. However, he may not have a reserve to further increase his heart rate under workload conditions. Normochonotropy, therefore, is such a level of heart rate, which produces a normal CI at a given level of SI. In the Table 1 above, both patients are normochronotropic.
When looking at Fig.1, you can see that while there are 8 classes of abnormal hemodynamic states, there is only one normohemodynamic state (a simultaneous normodynamic flow [SI] and normotension [MAP]). In addition, there is one normoperfusion state (CI within a normal range) produced by normochronotropy, as concluded from Table 1.
Normohemodynamic state in conjunction with normochronotropy is, therefore, the desired state - a therapeutic goal - for all patients whose hemodynamic points are located in one of the 8 rectangles of abnormal hemodynamic states and/or whose heart rate is at a hypo- or hyperchronotropic level.
In summary: The normohemodynamic state is a consequence of normal levels of hemodynamic modulators, i.e., normovolemia, normoinotropy and normovasoactivity. The normoperfusion state is then a result of normochronotropy.
We can rephrase the discussion above the following way: Patients with abnormal hemodynamics are either hyper- or hypotensive, or hyper- or hypodynamic, or in a linear combination of both. Their abnormal hemodynamic state is a result of one or more of their hemodynamic modulators to be at an abnormal level. Abnormal hemodynamics caused by abnormal levels in hemodynamic modulators represents a majority of hypertensive cases. Their correct treatment involves identification of the modulator(s), which are at abnormal level and correcting them therapeutically.
For instance for hypertension caused by hypervolemia, diuretics are the correct therapy. For hypertension caused by hyperinotropy, negative inotropes are the correct therapy (negative inotropes are one component of beta-blockers or calcium channel blockers). For hypertension caused by vasoconstriction, vasodilators, ACE-Inhibitors (Angiotensin Converting Enzyme Inhibitors = antivasoconstrictors) or ARBs (Angiotensin Receptor Blockers) are the correct therapy. For hypertension caused by a combination of hyperinotropy and vasoconstriction, calcium channel blockers are the correct therapy. For hypertension caused by vasoconstriction and hypervolemia, ACE-inhibitors (or ARBs) and diuretics are the correct therapy…
A physician treating hypertension the "conventional way" by administering antihypertensive medication through random selection, or recommendation of pharmacological company, is treating the symptom (i.e., the hypertension) and not the cause(s) – the abnormal levels in hemodynamic modulators. By treating blood pressure alone, he neglects his main responsibility for the well being of his patient, which is to produce normal perfusion of all his tissues.
As a result of the trial-and-error drug selection methodology, the physician treating hypertension the "conventional way" will be successful with a correct choice in about one in four patients. His outcomes will coincide with the outcomes listed in NIH Report at the beginning of this article.
This discussion also rebuffs the validity of placebo tests – a current methodology of pharmacological industry to prove efficacy of their new silver bullet drug to treat hypertension. If, as we discussed above, hypertension of any individual is caused by his specific and unique contribution of abnormal levels in hemodynamic modulators, then in any placebo test, there will be a subgroup of patients in whom the tested drug will have a desired effect (reducing the blood pressure). For instance, if a diuretic and placebo are given to hypertensive patients divided into a placebo and a control group, all patients in the placebo group will remain hypertensive, while a diuretic will reduce blood pressure on short-term basis in many control group patients, however, on long-term basis only in those patients whose hypertension was caused by hypervolemia. In the rest of hypertensives in the study (both in the placebo and the control group), whose causes of hypertension are hyperinotropy or vasoconstriction and/or their combination, neither the diuretics nor the placebo will have any sustaining, long-term effect on their blood pressure and these patients will remain hypertensive.
The exceptions to abnormal hemodynamic states, which cannot be treated by correction of identified abnormal level of hemodynamic modulators, are the endocrionological disorders, electrical conduction disorders or sepsis, and hypertension caused by renal disorders. These abnormalities, though demonstrating themselves also as an abnormal hemodynamic state, require an identification and treatment of their true causes. Therapeutic treatment of identified level in hemodynamic modulators in these patients may produce a temporary normohemodynamic state. However, the true cause will, in a matter of time, move the patient’s hemodynamic point to its original position on the hemodynamic map where it resided before the therapy.
Please note that in this entire discussion of perfusion of body tissues the blood pressure has not been mentioned.
In summary, we can state the following:
A physician who treats hypertension the "conventional way" treats only the symptom and will produce normotension in the first therapeutic attempt only in some of his patients. Even if normotension is achieved, he still does not know if the perfusion of all patient’s organs is adequate. Statistically speaking, normal perfusion takes place only in a subgroup of "successfully" treated hypertensives, in which the trial-and-error-selected drug matches the hemodynamic cause(s). (See Fig.6 with an example of a patient in whom an incorrectly selected therapy produced normotension at the expense of a profound hypoperfusion).
A physician who wants to treat any hemodynamic or perfusion blood flow disorder (including hypertension and the low-flow state), therefore, has to measure complete hemodynamics and perfusion flow dynamics (i.e., SI, MAP, HR, CI) in every single patient.
He has to identify which of the measured parameters are within their normal ranges for the patient, according to his gender and age, which parameters and infranormal and which are supranormal.
Should he decide the observed deviation(s) require(s) treatment, he has to identify which of the three hemodynamic modulators (volume, inotropy, and vasoactivity) and one perfusion modulator (chronotropy) exhibits abnormal level(s) and by how many percent.
He has to select such a cardio- and/or vasoactive drug, or a combination of drugs, which match by their hemodynamic vectorial action the different hemodynamic need of each patient.
From the percentage deviations in the identified hemodynamic modulators, he has to select a proper titration of these drugs as to produce normovolemia, normoinotropy, normovasoactivity and normochronotropy.
As a result of normal levels of hemodynamic and perfusion flow modulators, the patient then will become normohemodynamic with a normoperfusion blood flow – a necessary condition for healthy life.
A patient’s body may respond to the normohemodynamic therapy on a long-term basis. A periodic check-up and minor tune-ups of selected therapy may be needed.
A physician has in his hemodynamic management toolbox eight cardioactive and/or vasoactive tools to correct therapeutically any hemodynamic cause of identified abnormal hemodynamic or perfusion blood flow states:
Volume expanders.
Volume expansion is a correct cardioactive therapy for treatment of hypovolemia (by increasing the drip rate if the patient has an intravenous access, otherwise by having the patient to increase his fluid intake).
Therapeutic correction of this modulator is usually not involved in treatment of hypertension. However, hypovolemia is the major cause of hypotension and hypoperfusion in postoperative patients and in-patients in the intensive care.
Volume reducers (diuretics).
Diuresis is a correct cardioactive therapy to treat hypervolemia.
Positive inotropes.
Positive inotropes are correct choice cardioactive drugs to treat hypoinotropy.
Therapeutic correction of this modulator is usually not involved in treatment of hypertension.
Negative inotropes.
Negative inotropes are cardioactive drugs for treatment of hyperinotropy.
Vasodilators, ACE Inhibitors or ARBs.
Vasodilators, ACE inhibitors or ARBs are correct vasoactive drugs for treatment of vasoconstriction.
Vasoconstrictors.
Vasoconstrictors are correct vasoactive drugs for treatment of vasodilation.
Therapeutic correction of this modulator is usually not involved in treatment of hypertension.
Positive chronotropes.
Positive chronotropes are a correct cardioactive therapeutic choice for treatment of hypochronotropy.
Therapeutic correction of this modulator is usually not involved in treatment of hypertension.
Negative chronotropes.
Negative chronotropes are a correct cardioactive therapeutic choice for treatment of hyperchronotropy.
Please be aware that the tens of cardioactive and vasoactive drugs on the market are composed of these above-listed, pharmacologically controlled, building blocks (volume expansion is the only therapy, which has to be done by physical and not pharmacological means). Please also note that all antihypertensive medications are composed of only the following building blocks:
• diuretics,
• negative inotropes,
• vasodilators,
• ACE-inhibitors
• ARBs.
Unfortunately, the often-popular choice of antihypertensive drug - the beta-blocker (BB)- contains a combination of negative inotropes and negative chronotropes; BB negative inotropic effect lowers MAP (desired) and SI (often undesired) while its negative chronotropic effect also lowers the level of HR and prevents its often-needed increase to compensate for the resulting lower SI and CI.
End of theory.
So with this basic knowledge of hemodynamics, your expanded intellectual curiosity will no longer be satisfied with assessment of your cardiovascular system with blood pressure measurement alone. How to measure and add the all-important blood flow measurement to the armament of hemodynamic assessment?
Clinical measurement of CI has been available since the second half of the ‘70s. However, this blood flow measurement was highly invasive: It used the flow-directed, thermodilution catheter (also known as the Swan-Ganz catheter), which represented major risks to the patient (up to 4% mortalities and up to 50% morbidities). In addition, this technique is expensive (the cost of catheterization is several thousands dollars) and requires a skilled physician and a sterile environment for catheter insertion. As a result, it has been used only in very narrow strata (less than 2%) of critically ill and high-risk patients in whom the knowledge of blood flow and oxygen transport outweighed the risks of the method.
However, the progress did not stop in the ‘70s with the clinical acceptance of the thermodilution catheter. In fact, about the same time, the development of a noninvasive technique for measurement of SI, HR, CI and other cardiodynamic parameters started to gain speed and reached full maturity by the end of the ‘80s. This noninvasive technology is called the Thoracic Electrical Bioimpedance (TEB). It was used by NASA in the ‘70s for cardiovascular assessment of astronauts and enhanced in the ‘80s by adding an estimate of ejection fraction (developed under a NASA SBIR Contract) and a measurement of inotropic state.
The noninvasive capabilities of this TEB technology were further enhanced several years ago by a better understanding of cardiovascular physiology, specifically hemodynamics. It was discovered that the body adjusts the hemodynamic and perfusion states to a new level for every heart beat. Also, a clear understanding of interrelationship between hemodynamic and perfusion flow modulators and hemodynamic and perfusion flow state, as briefly described in the preceding section of this article, was found and defined. Though this article was written specifically for the seniors, representing only a subgroup of patients, hemodynamic states were recently measured in large groups of normal patient population. From these, normal hemodynamic states were determined for neonates and pediatric patients, for young adults, for older adults and for women during pregnancy.
These technological and cardiovascular physiology advances have been incorporated into a noninvasive system for assessment, monitoring, management and modeling of complete hemodynamics and oxygen transport dynamics (the HOTMAN System).
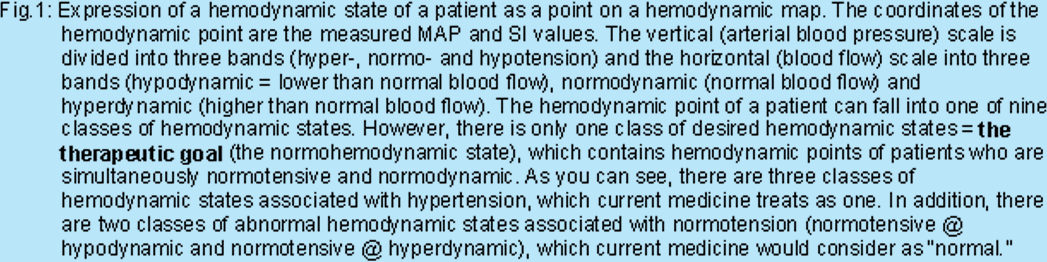
To explain the hemodynamic assessment and management capability of this system, below are the examples of hemodynamic data of a hypertensive patient obtained during his hemodynamic assessment, followed by new set of measurements taken one day later, after administration of a hemodynamically-correct therapy.
There are three types of data presentations, which the HOTMAN System provides. All of them are equally important to a clinician treating his patient.
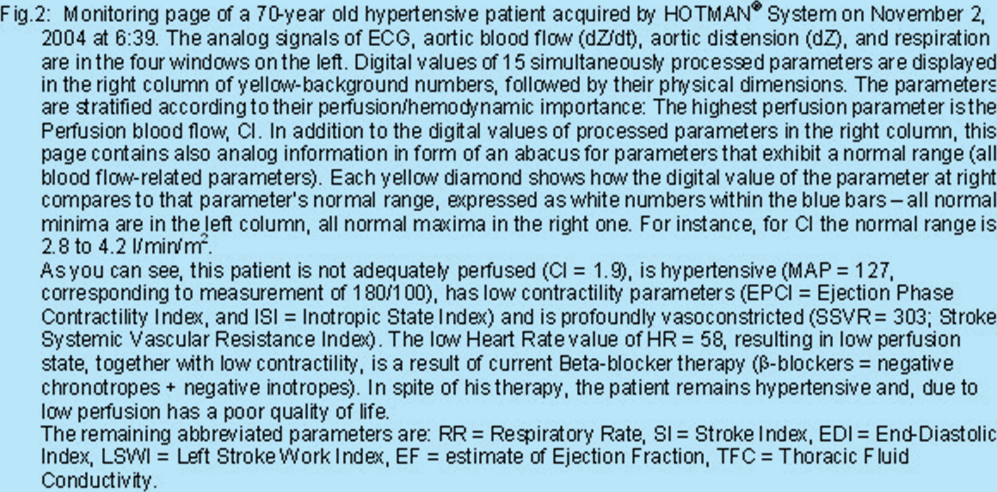
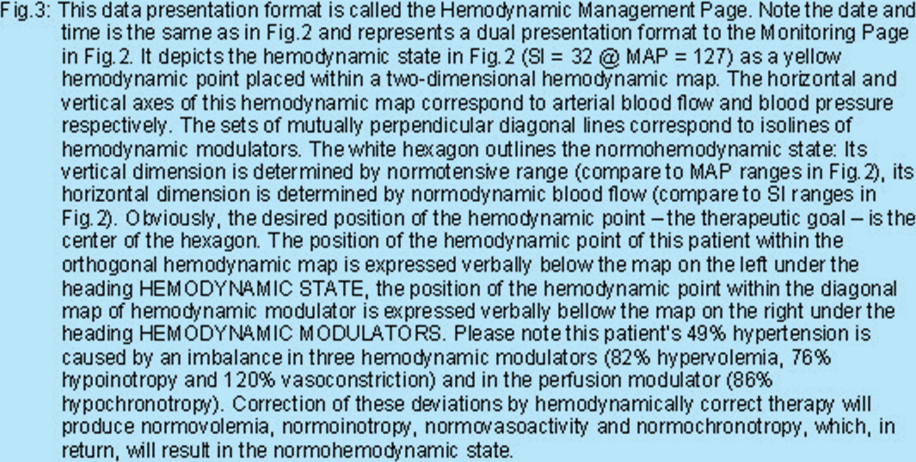
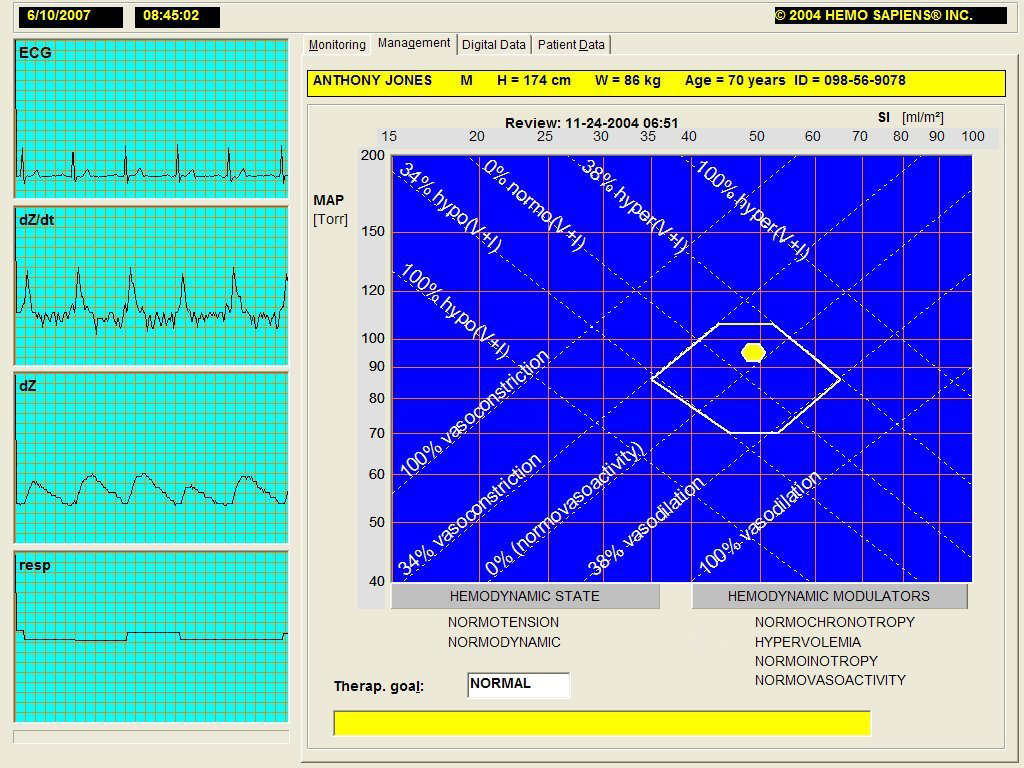
One provides an overview of a patient’s complete hemodynamics, including a clear indication, which of the 15 processed parameters are within their normal ranges, which are supranormal and which are infranormal. This is called the Monitoring Page. The examples of this page are in Fig.2 (initial hemodynamic assessment) and in Fig.4 (after the antihypertensive therapy).
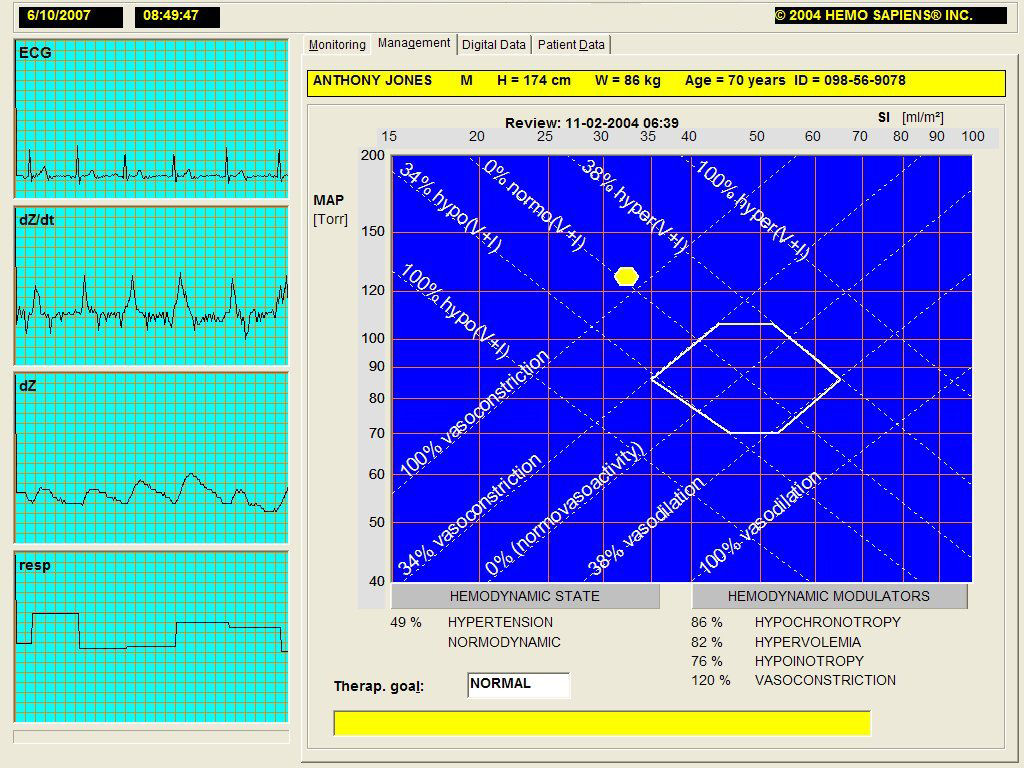
The second type of information this System provides the clinician is what to do with a patient therapeutically to achieve normodynamic and normoperfusion states. This is called the Hemodynamic Management Page. The examples of this page are in Fig.3 (initial hemodynamic assessment) and in Fig.5 (after the antihypertensive therapy).
Based upon information expressed in Figs.2 and 3, documenting the patient’s hemodynamic state at 06:39, the beta-blocker therapy was terminated and the patient was administered a combination of diuretics (25 mg Hydrochlorothiazide) and ACE inhibitors (25 mg of Benazepril). Also, this therapy was supplemented with a daily dose of 120 mg of Q-10 Coenzyme for its long-term positive inotropic effect.
The patient was measured agai the next day at 6:51. The corresponding Monitoring and Hemodynamic Management Pages are in Fig.4 and Fig.5.
The corresponding Hemodynamic Management Page is below:

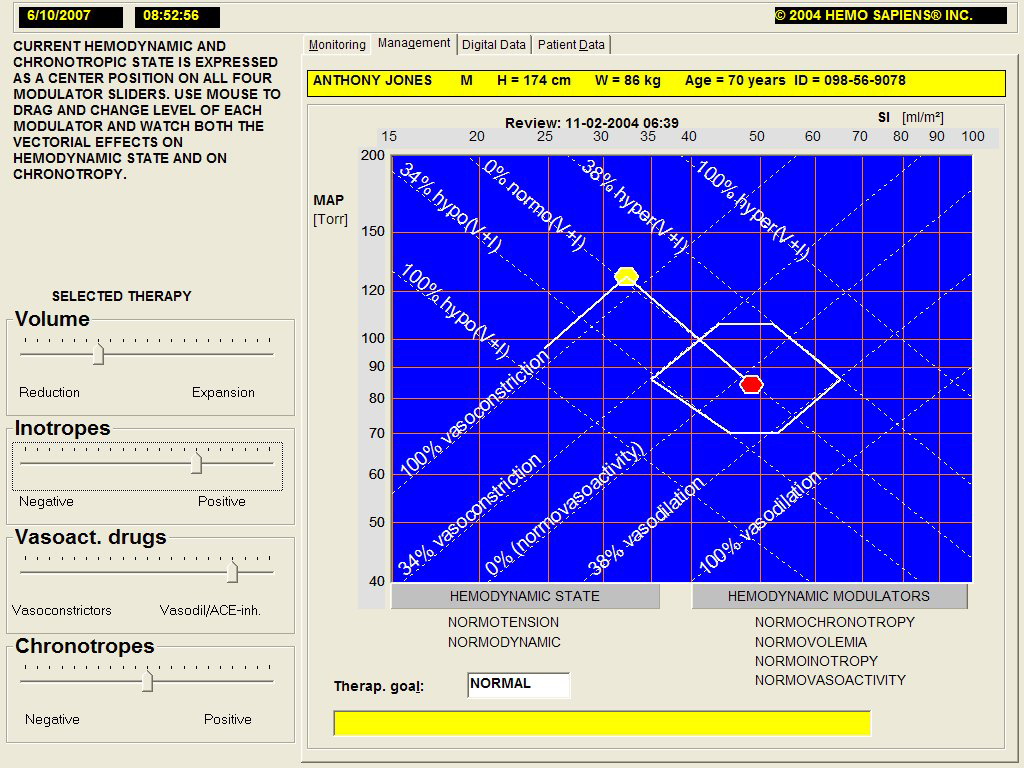
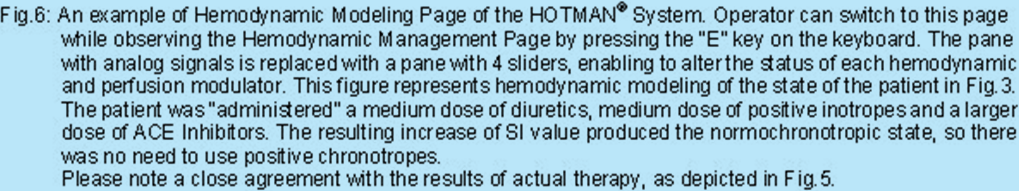
A third data presentation page is the Hemodynamic Modeling Page. On this page, the clinician can model the hemodynamic effects of any cardio- or vasoactive drug he may be intending to administer to a patient. This enables him to understand better the complexities of hemodynamic management. It also is an excellent teaching tool. An example of this page is in Fig.6.. This page allows the clinician to "administer" any cardio- and/or vasoactive drug to this patient (only on the screen, hence modeling) to see its hemodynamic effect. This feature allows him to see the consequences of any antihypertensive therapy he may be considering in the absence of the information available with the HOTMAN System (for instance, if he would use only blood pressure measurement in his therapy decision making process), without actually exposing the patient to each drug he may consider. This is very important, since the hemodynamic effects of some drugs (such as beta-blockers) cannot be reversed instantaneously, as they may require a long time to be metabolized by the body. This modeling feature of the HOTMAN System eliminates the negative hemodynamic consequences the patient would have to live with for days in case of an actual administration of such a drug as a result of trial-and-error management methodology utilized today. See Fig.6 with an example and discussion.
Hopefully, with this glimpse behind the hemodynamic scenes, you will be able to appreciate more the importance of hemodynamics in today’s medicine.
This article was not intended as a criticism of the current approach of treatment of hypertension. A century ago, nobody was aware of and nobody treated hypertension, since the sphygmomanometer was not discovered yet. However, after its discovery, it produced a wealth of information. Similarly, the very recent advances in TEB technology and cardiovascular physiology will enable us to make a giant leap in correct assessment and treatment of hypertension and other hemodynamic disorders.
Keep measuring your blood pressure. It is a quick and inexpensive form of a one-dimensional view of your hemodynamics. However, if you are hypertensive and are taking antihypertensive medication, or if you exhibit any symptoms of a low flow state discussed above, seek a complete hemodynamic examination by the HOTMAN System, which also includes the blood flow measurements.
When, as a result of correct therapy, you will become not only normotensive but be at the same time also normodynamic and in normoperfusion state, you will have both reduced the risk factors associated with hypertension and also feel better and have a better quality of life. The latter ones will be due to adequate perfusion of all your organs and tissues.
Good luck!