BETTER OUTCOMES:
A SIGNIFICANT MAJORITY OF
HYPERTENSION IS OF
HEMODYNAMIC ORIGIN AND
SHOULD BE TREATED AS
SUCH
B. Bo Sramek, Ph.D.
International Hemodynamic Society
www.hemodynamicsociety.org
For explanation of unfamiliar terms, go to Glossary of Terms.
Abstract:
Hypertension afflicts about 25% of adults 45-64 years of age and 39% of seniors over 65 years of age. Of these groups, about 55% of hypertensives are actually treated. In the treated patients, normotension is achieved in about 27% of them (The Sixth Report of the International Committee on Prevention, Detection, Evaluation and Treatment of High Blood Pressure; NIH 98-4080, November 1997). This is in spite of introduction of many new antihypertensive drugs over the last several decades.
These poor outcomes are attributable to an ingrained philosophy, which treats the symptom rather than the cause. As such, it defines hypertension as a blood pressure disorder, considers all available antihypertensive drugs just blood pressure reducing agents, and has the normotension as its only therapeutic goal. Under such conditions, a trial-and-error of selection of antihypertensive medication remains its only management methodology. Such a flawed philosophy, which disregards the new findings in cardiovascular physiology, has not only negative medical consequences (73% of hypertensives who take daily antihypertensive medications still remain hypertensive and many of them exhibit undesirable side effects), but has also a negative economic impact on healthcare cost (when these expensive medications are used without producing normotension, they are actually wasted).
Since the primary function of cardiovascular system is an adequate perfusion of all tissues - a blood flow and not blood pressure-related phenomenon - a correct treatment of hypertension must include both normal blood flow and normotension as its therapeutic goal. This new approach views hypertension as a hemodynamic disorder. With the recent advances in understanding systemic hemodynamics and new definitions of the bi-directional relationship between hemodynamic causes (the levels in three hemodynamic modulators - intravascular volume, inotropy and vasoactivity - and one perfusion flow modulator - chronotropy) and the hemodynamic consequences - the hemodynamic state (the level of arterial blood pressure and global blood flow), the outcomes of treatment of hypertension are now being significantly improved. This approach identifies a custom-tailored selection of antihypertensive drug(s), singular for each patient. It produces a much higher percentage of hypertensive patients who become normotensive faster and at a lower cost. In addition, these patients have, at the same time, normal tissue perfusion and, as a result, a better quality of life.
Summary of New Concepts in Systemic Hemodynamics
A systemic hemodynamic state consists of a simultaneously measured global blood flow and arterial blood pressure.
There are two global blood flows:
• A hemodynamically significant blood flow is the Stroke Index (SI) [ml/beat/m2] - a blood flow per heartbeat.
• A perfusion significant blood flow is the Cardiac Index (CI) [l/min/m2] - a blood flow per minute.
CI is produced as a result of a hemodynamically-formed value of SI and a chronotropic compensation by the Heart Rate (HR) [beats/min]:
CI = SI x HR/1000.
A hemodynamically significant arterial blood pressure is the Mean Arterial Pressure (MAP) [ Torr = mmHg].
The relationship between the Systolic (S), Diastolic (D) and Mean Arterial Pressure (MAP) is described by the following formula:
MAP = [(S - D)/3] + D.
A new pair of MAP and SI (a new hemodynamic state) is formed for every heartbeat as a result of a multivectorial, per-beat effects of three hemodynamic modulators - intravascular volume, inotropy and vasoactivity. The CI (perfusion blood flow) then includes the chronotropic compensatory effect by the HR - the perfusion flow modulator.
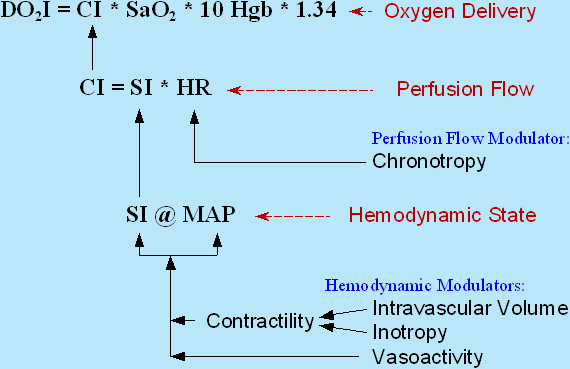
The mutual relationship between the hemodynamic and perfusion flow modulators (the causes) and the hemodynamic and the perfusion flow state (the consequences) and their effect on Oxygen Delivery Index (DO2I) is depicted in Fig.1 below:
Fig.1: A hemodynamic state (MAP @ SI) is formed per every heartbeat as a result of a multivectorial modulation by myocardial contractility (superimposed effects of intravascular volume & inotropy) and vascular resistance (vasoactivity). HR then acts as a chronotropic modulator in order to achieve a normal CI level even at infranormal values of SI. CI is then the only dynamic modulator of DO2I
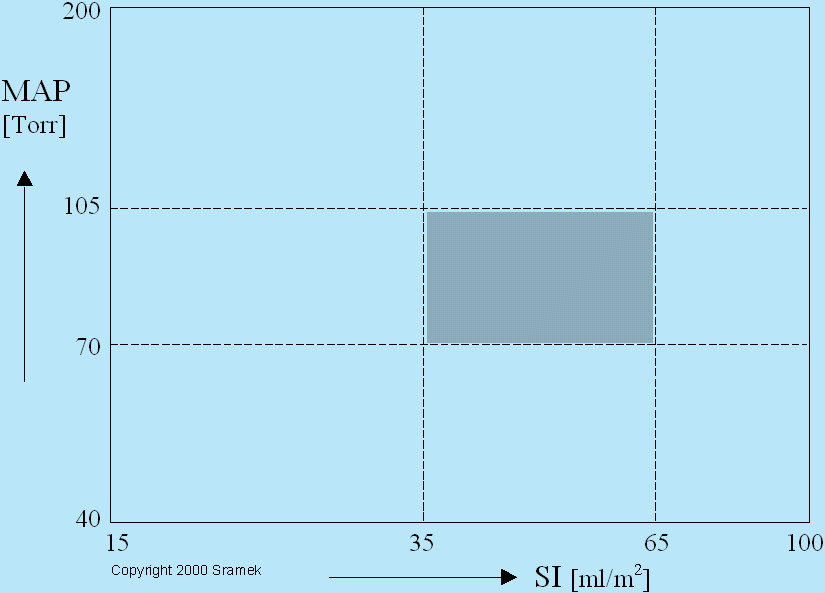
On a geographic map, a point on earth is determined by two coordinates - a latitude and a longitude. On a hemodynamic map, a hemodynamic state of a patient is determined by a hemodynamic point with two coordinates - MAP and SI values. A hemodynamic map for adults is depicted in Fig.2 below. Since a majority of biologic phenomena express a logarithmic relationship, this map has a logarithmic scale of both SI and MAP coordinates.
Fig.2: Hemodynamic map for adult humans. The hemodynamic state of a patient is determined by a hemodynamic point with coordinates of measured MAP and SI values. Normotension is delineated by two horizontal lines of MAP = 70 and 105 Torr. Hypertension is defined as MAP > 105 Torr, hypotension as MAP < 70 Torr. Normodynamic state is delineated by two vertical lines at SI = 35 and 65 ml/m2, hypodynamic state is defined as SI < 35, hyperdynamic state as SI > 65 ml/m2. The loci of normohemodynamic states (the therapeutic goal) are outlined by the gray rectangle.
As a result of three levels of MAP (hypotension, normotension and hypertension) and three levels of SI (hypodynamic, normodynamic and hyperdynamic state), there are nine classes of hemodynamic states, represented by nine rectangles in the map above: Hypertensive/hypodynamic, hypertensive/normodynamic,... Only one of the nine classes of hemodynamic states is the desired one - the simultaneous normotension and normodynamic state - the therapeutic goal (shown as a gray rectangle in Fig.2). A patient, who is normotensive and normodynamic, i.e., in a normohemodynamic state, is there only if all hemodynamic modulators are at their normal values, i.e., normovolemia, normoinotropy and normovasoactivity. An abnormal level in any hemodynamic modulator - hypovolemia or hypervolemia, hypoinotropy or hyperinotropy, and vasodilation or vasoconstriction, and/or any linear combination of them, moves a patient's hemodynamic point into one of the eight white rectangles of abnormal hemodynamic states in Fig.2.
Fig.2 represents the hemodynamic map (i.e., SI @ MAP relationship), where SI and MAP form a vertical and horizontal orthogonal system of coordinates, i.e., the hemodynamic modulating consequences). In contrast, the diagonal lines in Fig.3 represents also an orthogonal system of coordinates (at a different plane) indicating a mutually perpendicular vectorial direction of the effects of changes of the status in two basic hemodynamic modulators (i.e., the myocardial contractility and vascular resistance - the hemodynamic causes) on SI and MAP values. In an antihypertensive therapy, the following options are available:
• A decrease in myocardial contractility (either through diuresis or through the effect of negative inotropes) will move a patient's hemodynamic point along a set of parallel lines running from northeast to southwest, i.e., from the point the patient was at before the therapy toward southwest - it will decrease both the MAP and SI values.
• A decrease in vasoconstriction (either through administration of vasodilators or ACE Inhibitors) will move a patient's hemodynamic point along a set of parallel lines running from northwest to southeast, i.e., from the point the patient was at before the therapy toward southeast - it will decrease the MAP value while increasing the SI value.
• A multicomponent therapy (such as a combination therapy including diuretics and ACE Inhibitors) will move a patient's hemodynamic point along a vectorial sum of applied therapies.
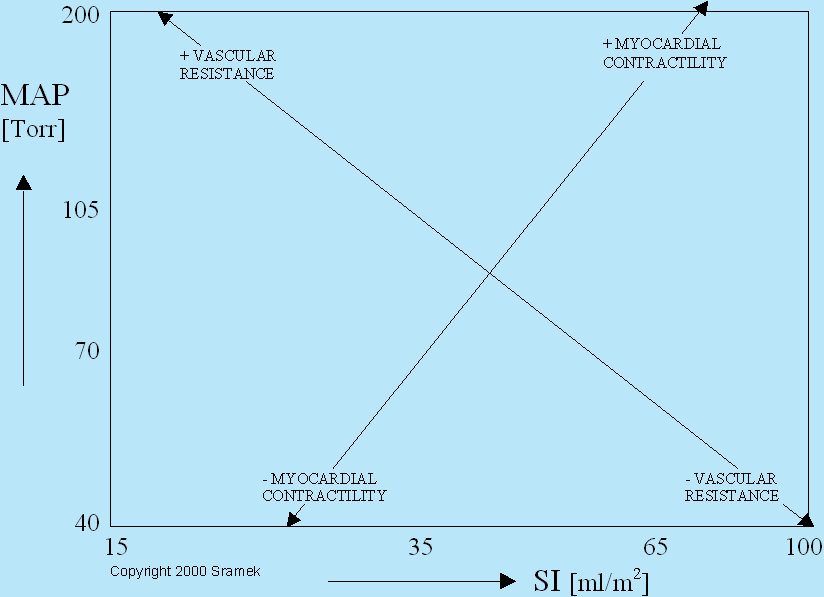
Fig.3: Changes in myocardial contractility will move a patient's hemodynamic point along a set of parallel lines running from northeast to southwest, while changes in vascular resistance will move a patient's hemodynamic point in a direction, which is perpendicular to the contractility vector, i.e., along a set of parallel lines running from northwest to southeast. Myocardial contractility consists of two superimposed phenomena: Effects of volemia +/- effects of inotropic state.
With the current understanding of per-beat hemodynamics, the interrelationship between the hemodynamic state (MAP & SI levels - Fig.2) and the hemodynamic and perfusion flow modulators (volume, inotropy, vasoactivity and chronotropy - Fig.3) is bidirectional: (a) By measuring MAP, SI and CI values, we can determine the percentage deviations in intravascular volume, inotropy, vasoactivity and chronotropy from their respective ideal states, or (b) by knowing the deviations in intravascular volume, inotropy, vasoactivity and chronotropy from their respective ideal states, we can predict (model) the levels of MAP, SI and CI.
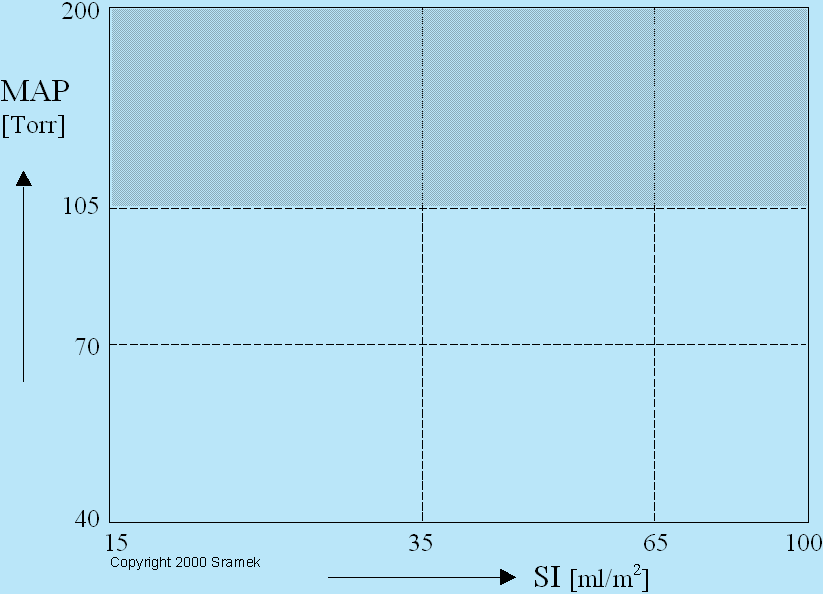
Hypertension (MAP > 105 mmHg = Torr), therefore, involves three classes of abnormal hemodynamic states (hypertensive/hypodynamic, hypertensive/normodynamic and hypertensive/hyperdynamic), depicted in Fig.4 below as a gray area, and is, generally, caused by either hypervolemia and/or hyperinotropy and/or vasoconstriction.
Fig.4: The gray area contains loci of hemodynamic states of all hypertensive patients: Hypertensive/hypodynamic, hypertensive/normodynamic and hypertensive/hyperdynamic.
It should be clear to the reader, that all classes of currently available antihypertensive drugs - diuretics, beta blockers, calcium channel blockers and ACE-inhibitors - do reduce the blood pressure, however, some, at the same time, reduce the blood flow, some maintain it at the same level and some increase it. We will be discussing their individual vectorial effects on the patient's hemodynamic point in the following section. Three different classes of hemodynamic states, encompassing the gray area in Fig.4 above, and considered by the current approach as "one hypertension" is the Achilles heal of the current definition of hypertension: The blood flow is not routinely measured during the hypertensive assessment and the so-called "side effects" of antihypertensive therapy, such as tiredness, male impotence, digestive disorders, body temperature control problems, sleepwalking,..., may not be side effects at all and just may be loud demonstrations of a low flow state.
Hemodynamic Vectorial Effects of Basic Classes of Antihypertensive Drugs
1. DIURETICS
The hemodynamic purpose of diuretics is to reduce the blood volume, i.e., they are a correct therapy to treat hypervolemia. The reduction of blood volume results in reduction of myocardial contractility through the mechanical pathway (the Frank-Starling mechanism), resulting in a decrease both in blood pressure (MAP) and in blood flow (SI), as shown in Fig.5:
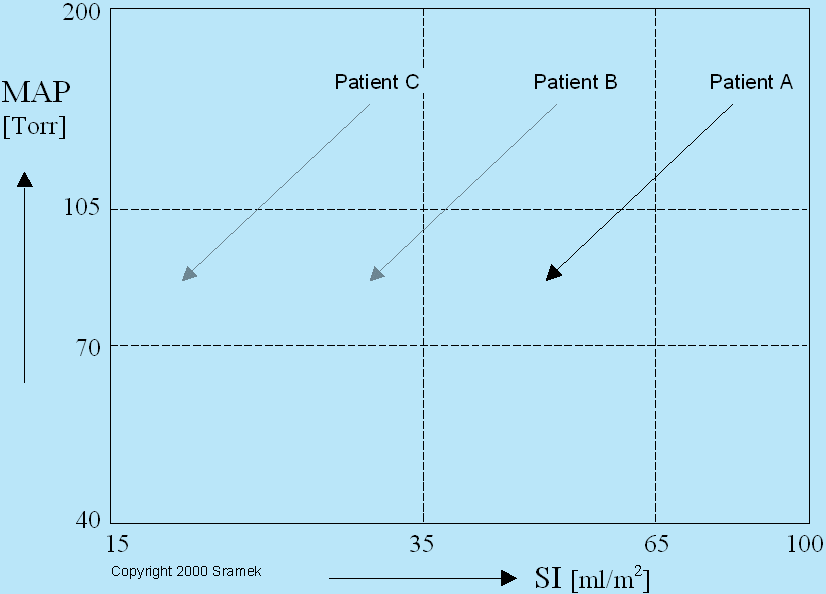
Fig.5: Vectorial effects of diuretics on three hypertensive patients with the same level of hypertension, however, at three different blood flow states. Patient A is hypertensive/hyperdynamic, Patient B is hypertensive/normodynamic and Patient C is hypertensive/hypodynamic. Since diuretics reduce the blood volume, thus reducing both the MAP and SI values though the Frank-Starling mechanism, they are a correct therapy for treatment of hypertension of Patient A (if his hypertension is caused by hypervolemia - compare to Patient D in Fig.6, whose hypertension is caused by hyperinotropy, though his hemodynamic state is the same as that of Patient A). Diuretics given to Patients B and C may reduce their blood pressure, however, the induced low flow state may demonstrate itself as the "side effects" described above, or, through complex biofeedback loops, may push the blood pressure back to its original hypertensive level.
2. BETA-BLOCKERS
The hemodynamic effect of beta blockers, being negative inotropes and negative chronotropes, is to reduce both the inotropic state and the heart rate, i.e., they are a correct therapy to treat hyperinotropy when associated with hyperchronotropy. Reduction of myocardial contractility through the pharmacological means (negative inotropic effect of beta blockers) leads to a decrease both in blood pressure (MAP) and in blood flow (SI), as shown in Fig.6. The reduction of SI then leads directly to reduction of the perfusion blood flow (CI) [CI = SI x HR]. The negative chronotropic effect of beta blockers also reduce the HR, which leads to a further reduction of CI. Unless the beta blockers are prescribed to reduce myocardial contractility as to reduce the myocardial oxygen consumption, they, usually, lead to most pronounced "side effects" described above, since their effect on reduction of CI, and the resulting reduction in tissues perfusion, is quadratic.
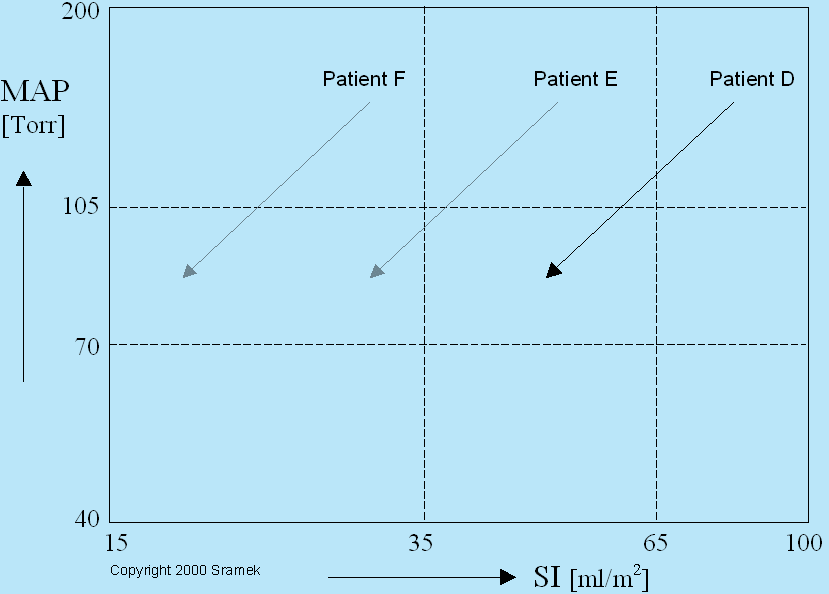
Fig.6: Vectorial effects of beta blockers on three hypertensive patients with the same level of hypertension, however, at three different blood flow states. Patient D is hypertensive/hyperdynamic, Patient E is hypertensive/normodynamic and Patient F is hypertensive/hypodynamic. Since beta blockers reduce the myocardial contractility through reduction of inotropic state, they cause both the decrease of MAP and decrease of SI values. They are a correct therapy for treatment of hypertension of Patient D (if his hypertension is caused by hyperinotropy and hyperchronotropy - compare to Patient A in Fig.5, whose hypertension is caused by hypervolemia, though his hemodynamic state is the same as that of Patient D). Administration of beta blockers to Patient E or F would produce a profound reduction of SI, which would result in a quadratic reduction of CI due to a simultaneous decrease of HR through its negative chronotropic effect.
3. ACE-INHIBITORS/VASODILATORS
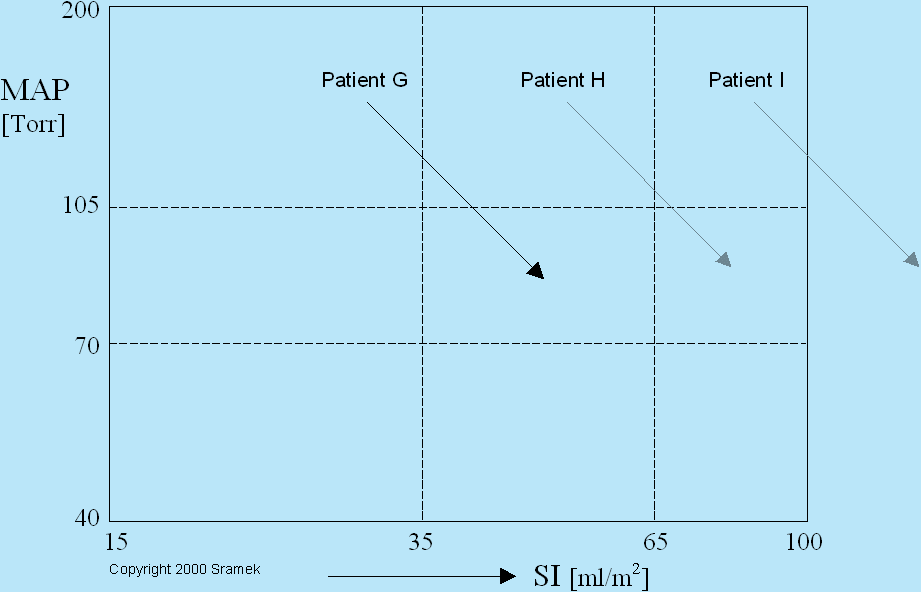
ACE (Angiotensin Converting Enzyme)-Inhibitors having anti-vasoconstricting effect produce the same hemodynamic effect as vasodilators. Their hemodynamic effect is perpendicular to that of diuretics and negative inotropes. ACE-Inhibitors and/or vasodilators reduce the MAP value while simultaneously increasing the SI and are a correct therapy for hypertensive/hypodynamic patients, whose hypertension is caused by vasoconstriction and reduced arterial compliance. See Fig.7 for their vectorial effects.
Fig.7: Hemodynamic modulating effects by ACE-Inhibitors and vasodilators. They are clearly a correct therapy for Patient G, if his hypertension is caused primarily by vasoconstriction. Administered to Patients H or I, they would produce normotension while pushing the patient's hemodynamics into a hyperdynamic state, thus increasing unnecessarily the load on the myocardium.
4. CALCIUM CHANNEL BLOCKERS
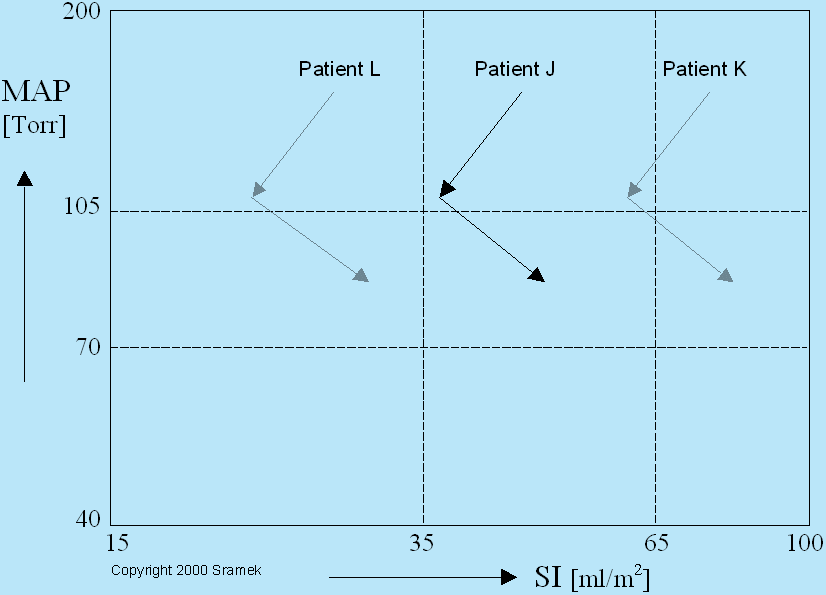
Calcium Channel Blockers consist, typically, of varying mixtures of negative inotropes and vasodilators. Their hemodynamic effect is a vectorial sum of these two pathways, as shown in Fig.8 below. Generally, they reduce the MAP value while maintaining SI approximately at its pre-therapy level. Keep in mind, they are a correct therapy only for those hypertensive patients whose hypertension causes were determined to be hyperinotropy and vacoconstriction.
Fig.8: Calcium Channel Blockers produce a hemodynamic modulating effect, which is a vectorial sum of negative inotropes and vasodilators. Though they would produce normotension in all three example patients (Patients J, K, L), they are a correct therapy for Patient J only (if his hypertension is caused by a combination of hyperinotropy and vasoconstriction). Given to Patient L, he would become normotensive/hypodynamic, while Patient K would become normotensive/hyperdynamic.
An Example of Correct Treatment of a Hypertensive Patient
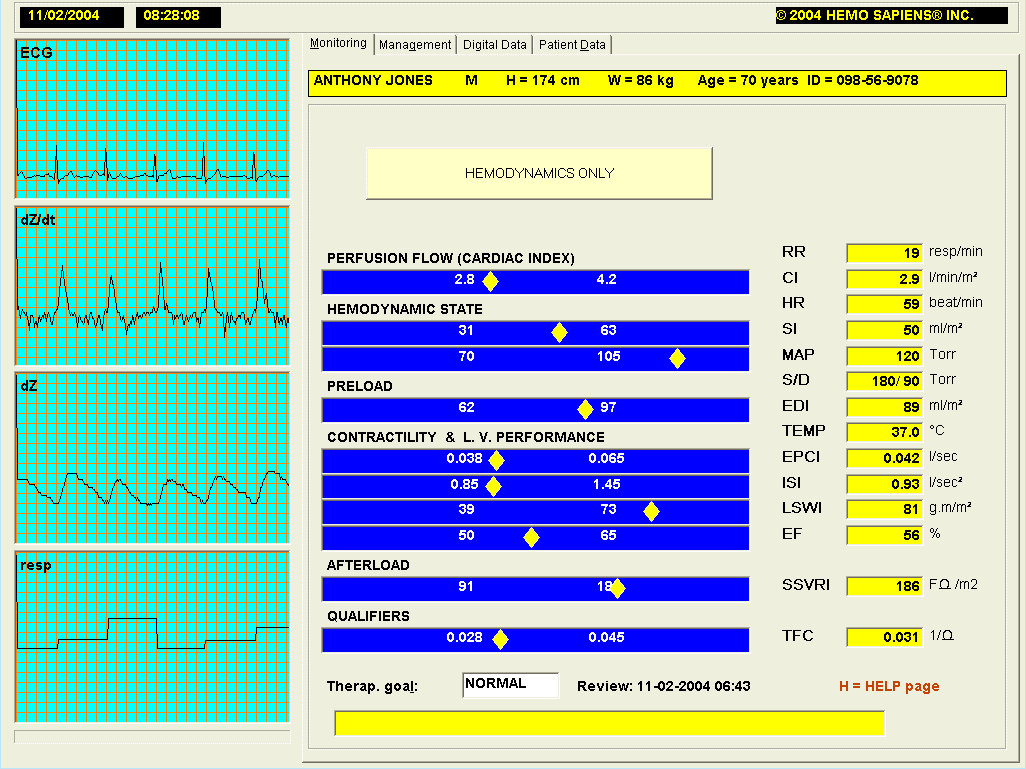
The following case involves a 70-year old hypertensive patient, who has remained hypertensive with a conventional therapy. His hemodynamics were measured by the HOTMAN System. The HOTMAN uses the TEB (Thoracic Electrical Bioimpedance) Technology for a continuous measurement of CI, SI, HR and other cardiodynamic and respiratory parameter, including the measurement if ISI (Inotropic State Index). It has the new patented concepts of hemodynamic management and modeling, described in the Summary above, implemented in its software. Patient's blood pressure was measured by a manual sphygmomanometer and the values of Systolic = 180, Diastolic = 90 Torr were entered via the system's keyboard.
The patient's hemodynamic state assessment page (the Monitoring Page) is in Fig.9 below.
Fig.9: Hemodynamic assessment page of a hypertensive patient. At the time of this measurement, this patient has CI = 2.9 l/min/m2, SI = 50 ml/m2 and MAP = 120 Torr (180/90 Torr). Yellow diamonds within blue horizontal bars display the value of respected parameter in analog fashion when compared to a parameter's normal range (white numbers within blue bars).
This hypertensive/normodynamic patient falls within a more complex - two component therapy, as indicated in Fig.10 below. His hypertension is caused either by hypervolemia or hyperinotropy (see Fig.5 and Fig.6 for vectorial directions of their respective therapies) and by vasoconstriction (see Fig.7 for the vectorial direction of a therapy to treat vasoconstriction).
Fig.10: Graphical presentation of hemodynamic causes of hypertension of patient Jones from Fig.9. In order to produce a normohemodynamic state, the patient needs either diuretics of negative inotropes (the upper arrow) and ACE-Inhibitors (the lower arrow).
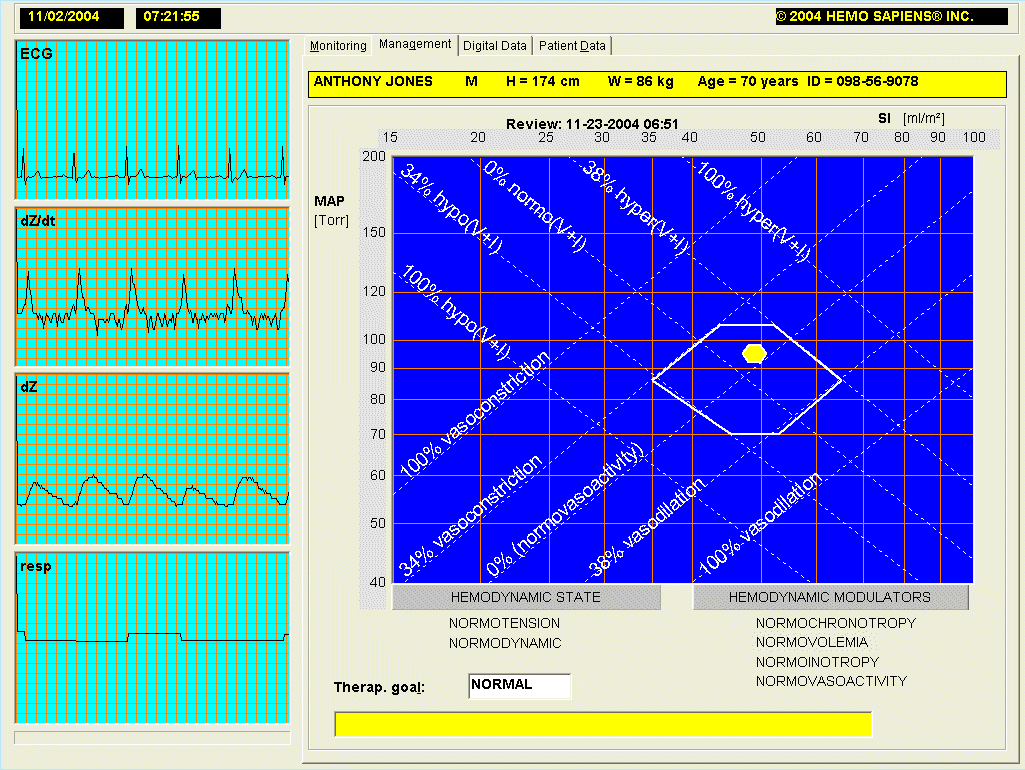
The HOTMAN System's Hemodynamic Management Page resolves all analysis of possible causes in one glance, as documented in Fig.11 below. Due to the capability of TEB technology to measure directly the inotropic state, the System separates automatically the vectorial effects of intravascular volume from the effects of inotropic state. As you can see from Fig.8, the ISI = 0.93 (Inotropic State Index) value is within a normal range for the gender and age of this patient (0.85-1.45). The Hemodynamic Management page describes the patients hemodynamics as a yellow point and defines clearly the percentage deviation in hemodynamic causes under HEMODYNAMIC MODULATORS, and the consequence under the HEMODYNAMIC STATE. This patient's 41% hypertension is caused by a 77% hypervolemia and 34% vasoconstriction.

Fig.11: Hemodynamic Management Page of the HOTMAN System: Patients hemodynamic state is expressed as a yellow dot with coordinates of MAP = 120 and SI = 50. His 41% hypertension @ normodynamic state is caused by 77% hypervolemia and 34% vasoconstriction, indicating a dose of diuretics and ACE-Inhibitors with a 2:1 ratio.
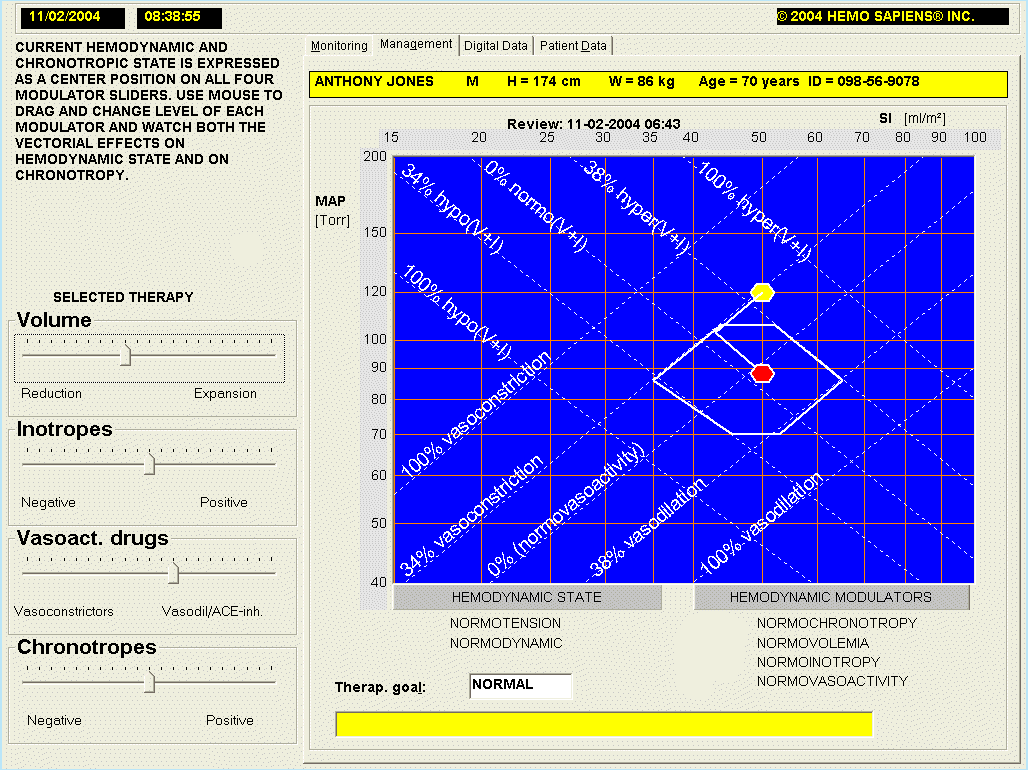
A major educational advantage of the HOTMAN System is its capability to model the effects of cardioactive and vasoactive drugs and thus predict the future position of hemodynamic point after any therapy is selected. The Fig.12 below shows the Hemodynamic Modeling Page of the System.
Fig.12: Hemodynamic Modeling Page of HOTMAN System: The existing hemodynamic state is shown as a yellow dot, the future (predicted) hemodynamic state as a red dot. At the onset of modeling, all sliders for adjustment of status of individual hemodynamic and perfusion flow modulators are in their respective center positions. This patient was first "administered" diuretics, until the deviation in hypervolemia changed to "normovolemia." He was then "administered" ACE-Inhibitors till vasoconstriction changed to "normovasoactivity."
After the hemodynamic assessment described above, this patient was prescribed a daily dose of 25 mg of Hydrochlorothiazide (a diuretic) and 10 mg of Benazepril (an ACE-Inhibitor). Fig.13 below shows the actual hemodynamics of patient Jones recorded three weeks later. Please note a reasonable agreement between the predicted hemodynamic state in Fig.12 and actual hemodynamic state in Fig.13.
Fig.13: Actual hemodynamic state of patient Jones recorded three weeks after the initial assessment (Figs.9 & 11), after he was prescribed a daily dose of 25 mg of Hydrochlorothiazide (a diuretic) and 10 mg of Benazepril (an ACE-Inhibitor)
We have documented here that hypertension has to be treated as a hemodynamic and not just a simple blood pressure disorder. Utilizing modern concepts of beat hemodynamics, the outcomes of treatment of hypertension can now be significantly improved. It is estimated that over 80% of hypertensions are of hemodynamic origin, which can be successfully treated this way in one or two visits. This approach identifies a custom-tailored selection of antihypertensive drugs, different for each patient. It produces a much higher percentage of hypertensive patients who become normotensive faster and at a lower cost. In addition, these patients have, at the same time, a normal tissue perfusion and, as a result, a better quality of life.
To see the efficacy of this method on a large group of hypertensives, read the abstract of a paper Normohemodynamic Goal-oriented Therapy Improves the Outcome, presented at the 11th Scientific Meeting of The American Society of Hypertension.